

You can grow your live streaming audience by improving the quality of your broadcasts, and by analyzing viewership data to improve your viewer's experience. The total number of viewers for your broadcasts is a great statistic to know, but access to in-depth analytics can help you learn more. In this Help article, we will break down what viewer analytics you have access to and where to find them.
To find your analytics for a live or past broadcast follow these steps below.
1. Click on that broadcast and click on analytics below the video player.
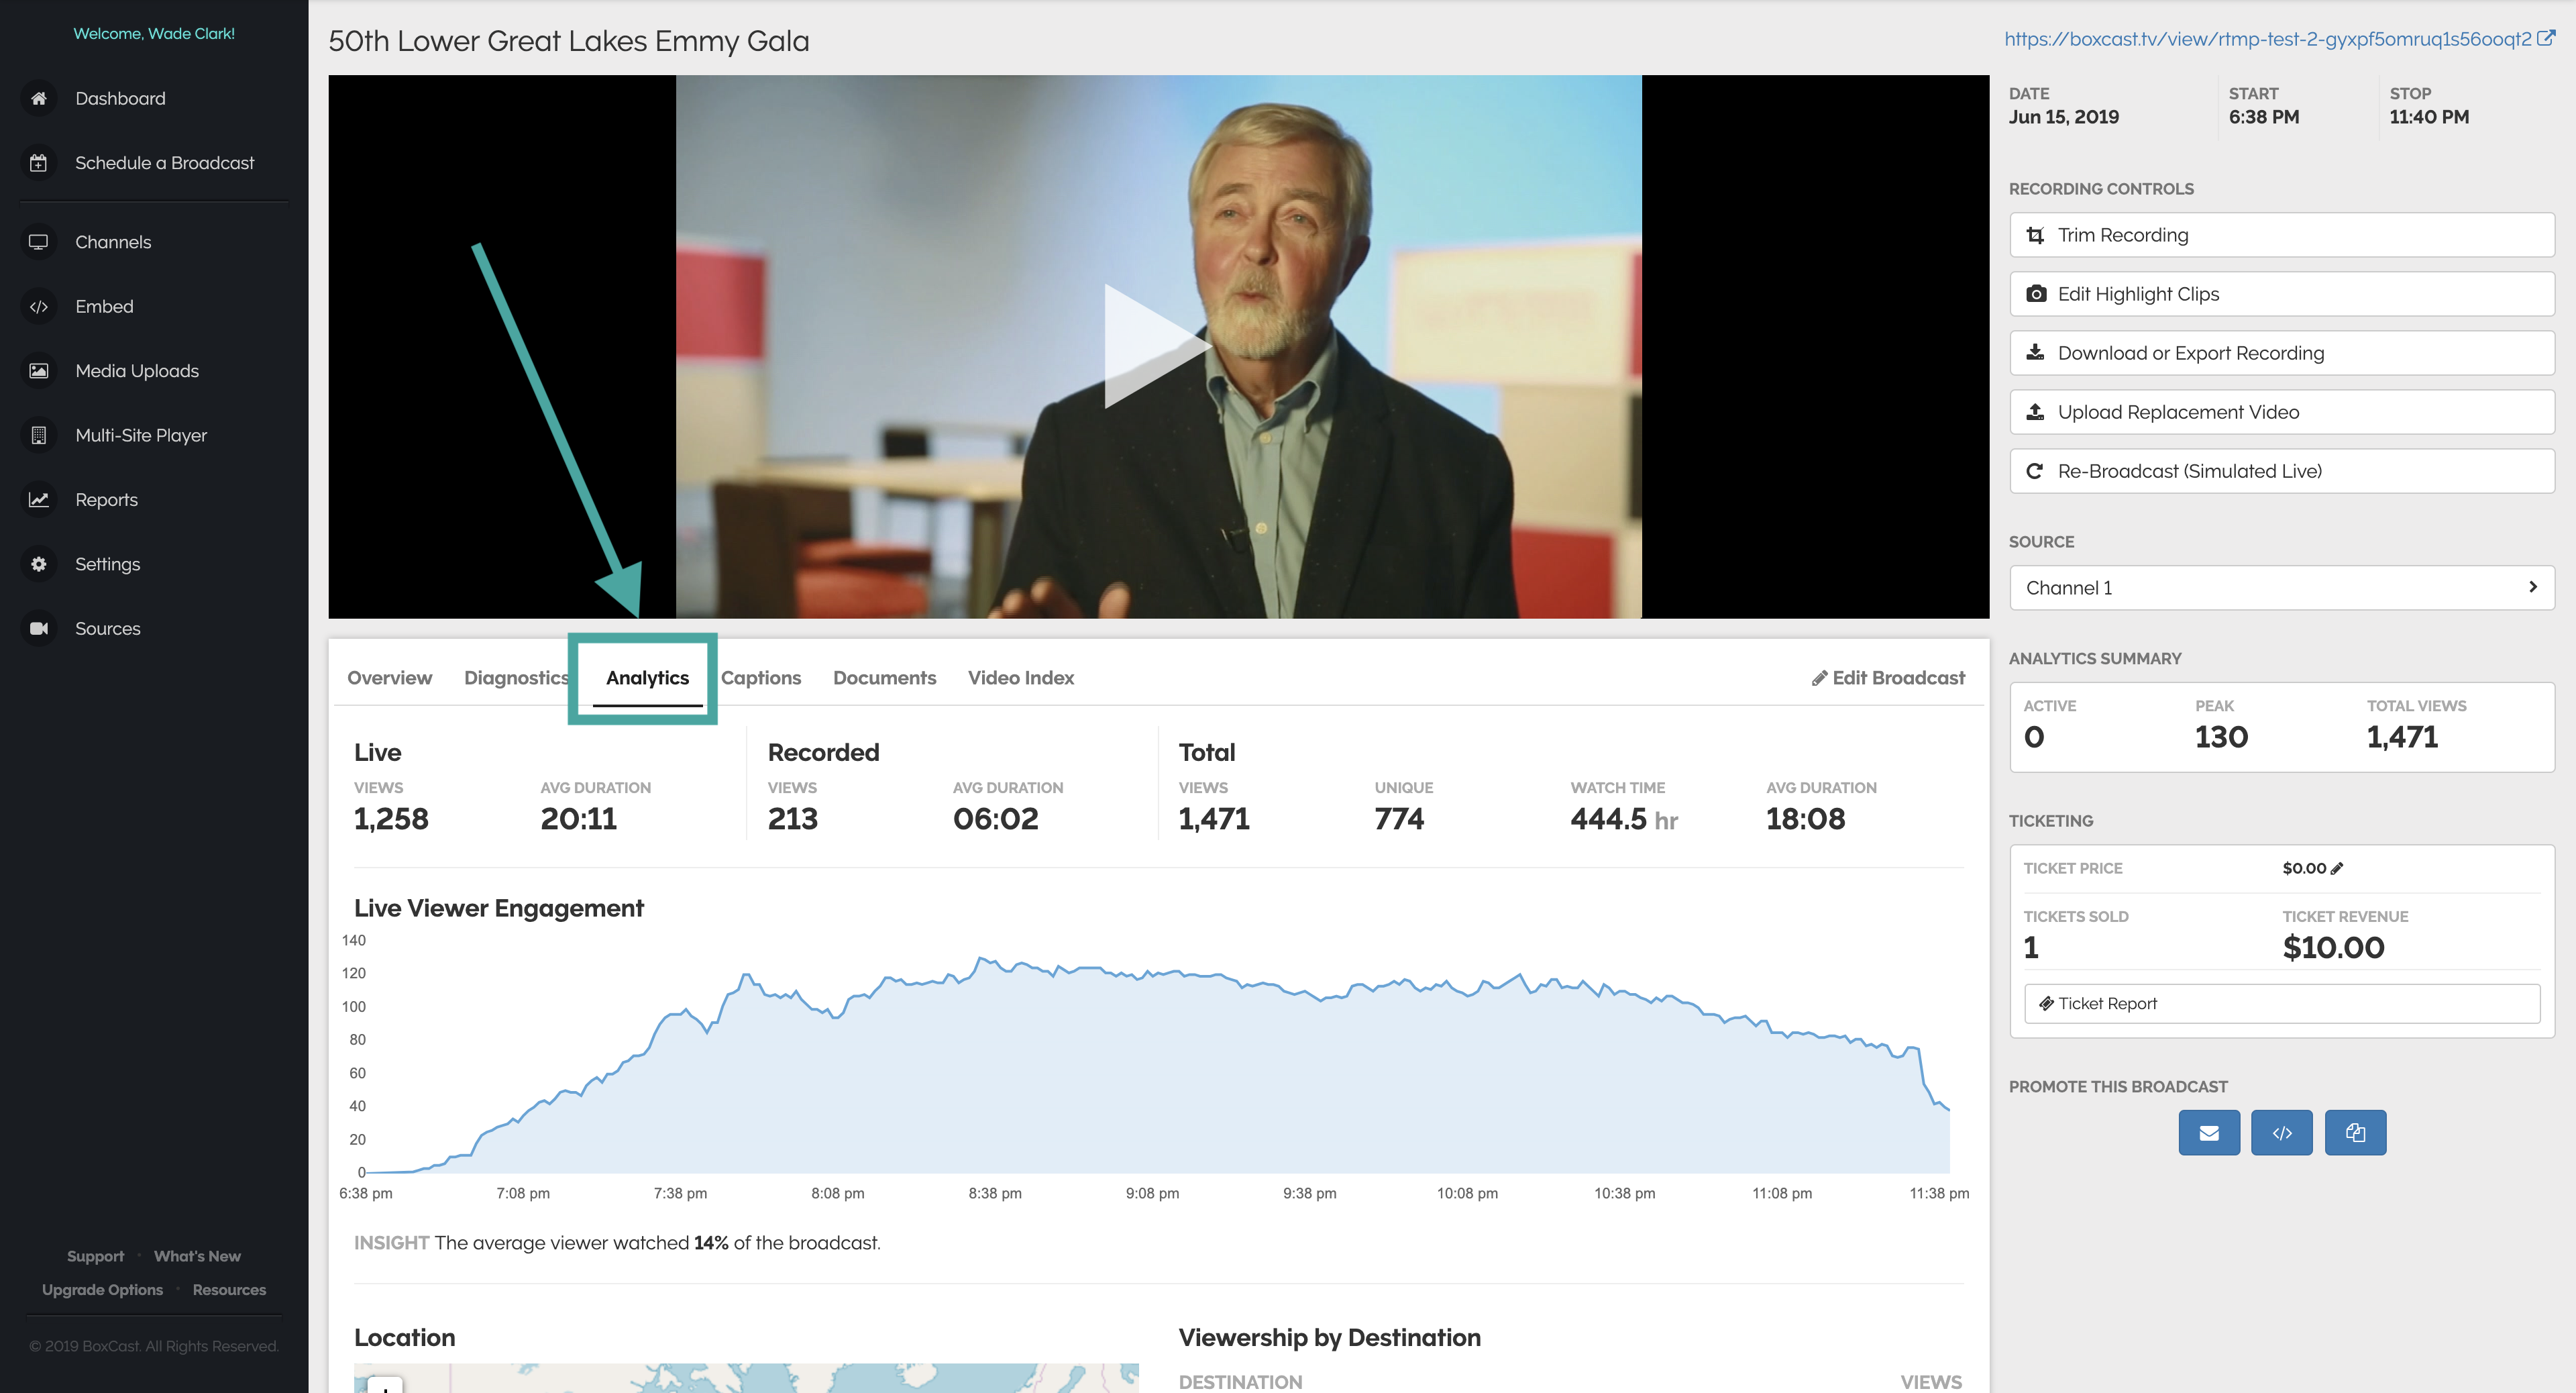
You will notice that we track Live broadcast stats and Recorded broadcast stats. The Live Viewer Engagement will tell you how many people are actively watching at the time and will show an increase or decrease in viewership. Each broadcast also has it's on geolocation map that will show you where viewers are watching from.
2. To get a more detailed look at that broadcast click on "View Detailed Analytics."
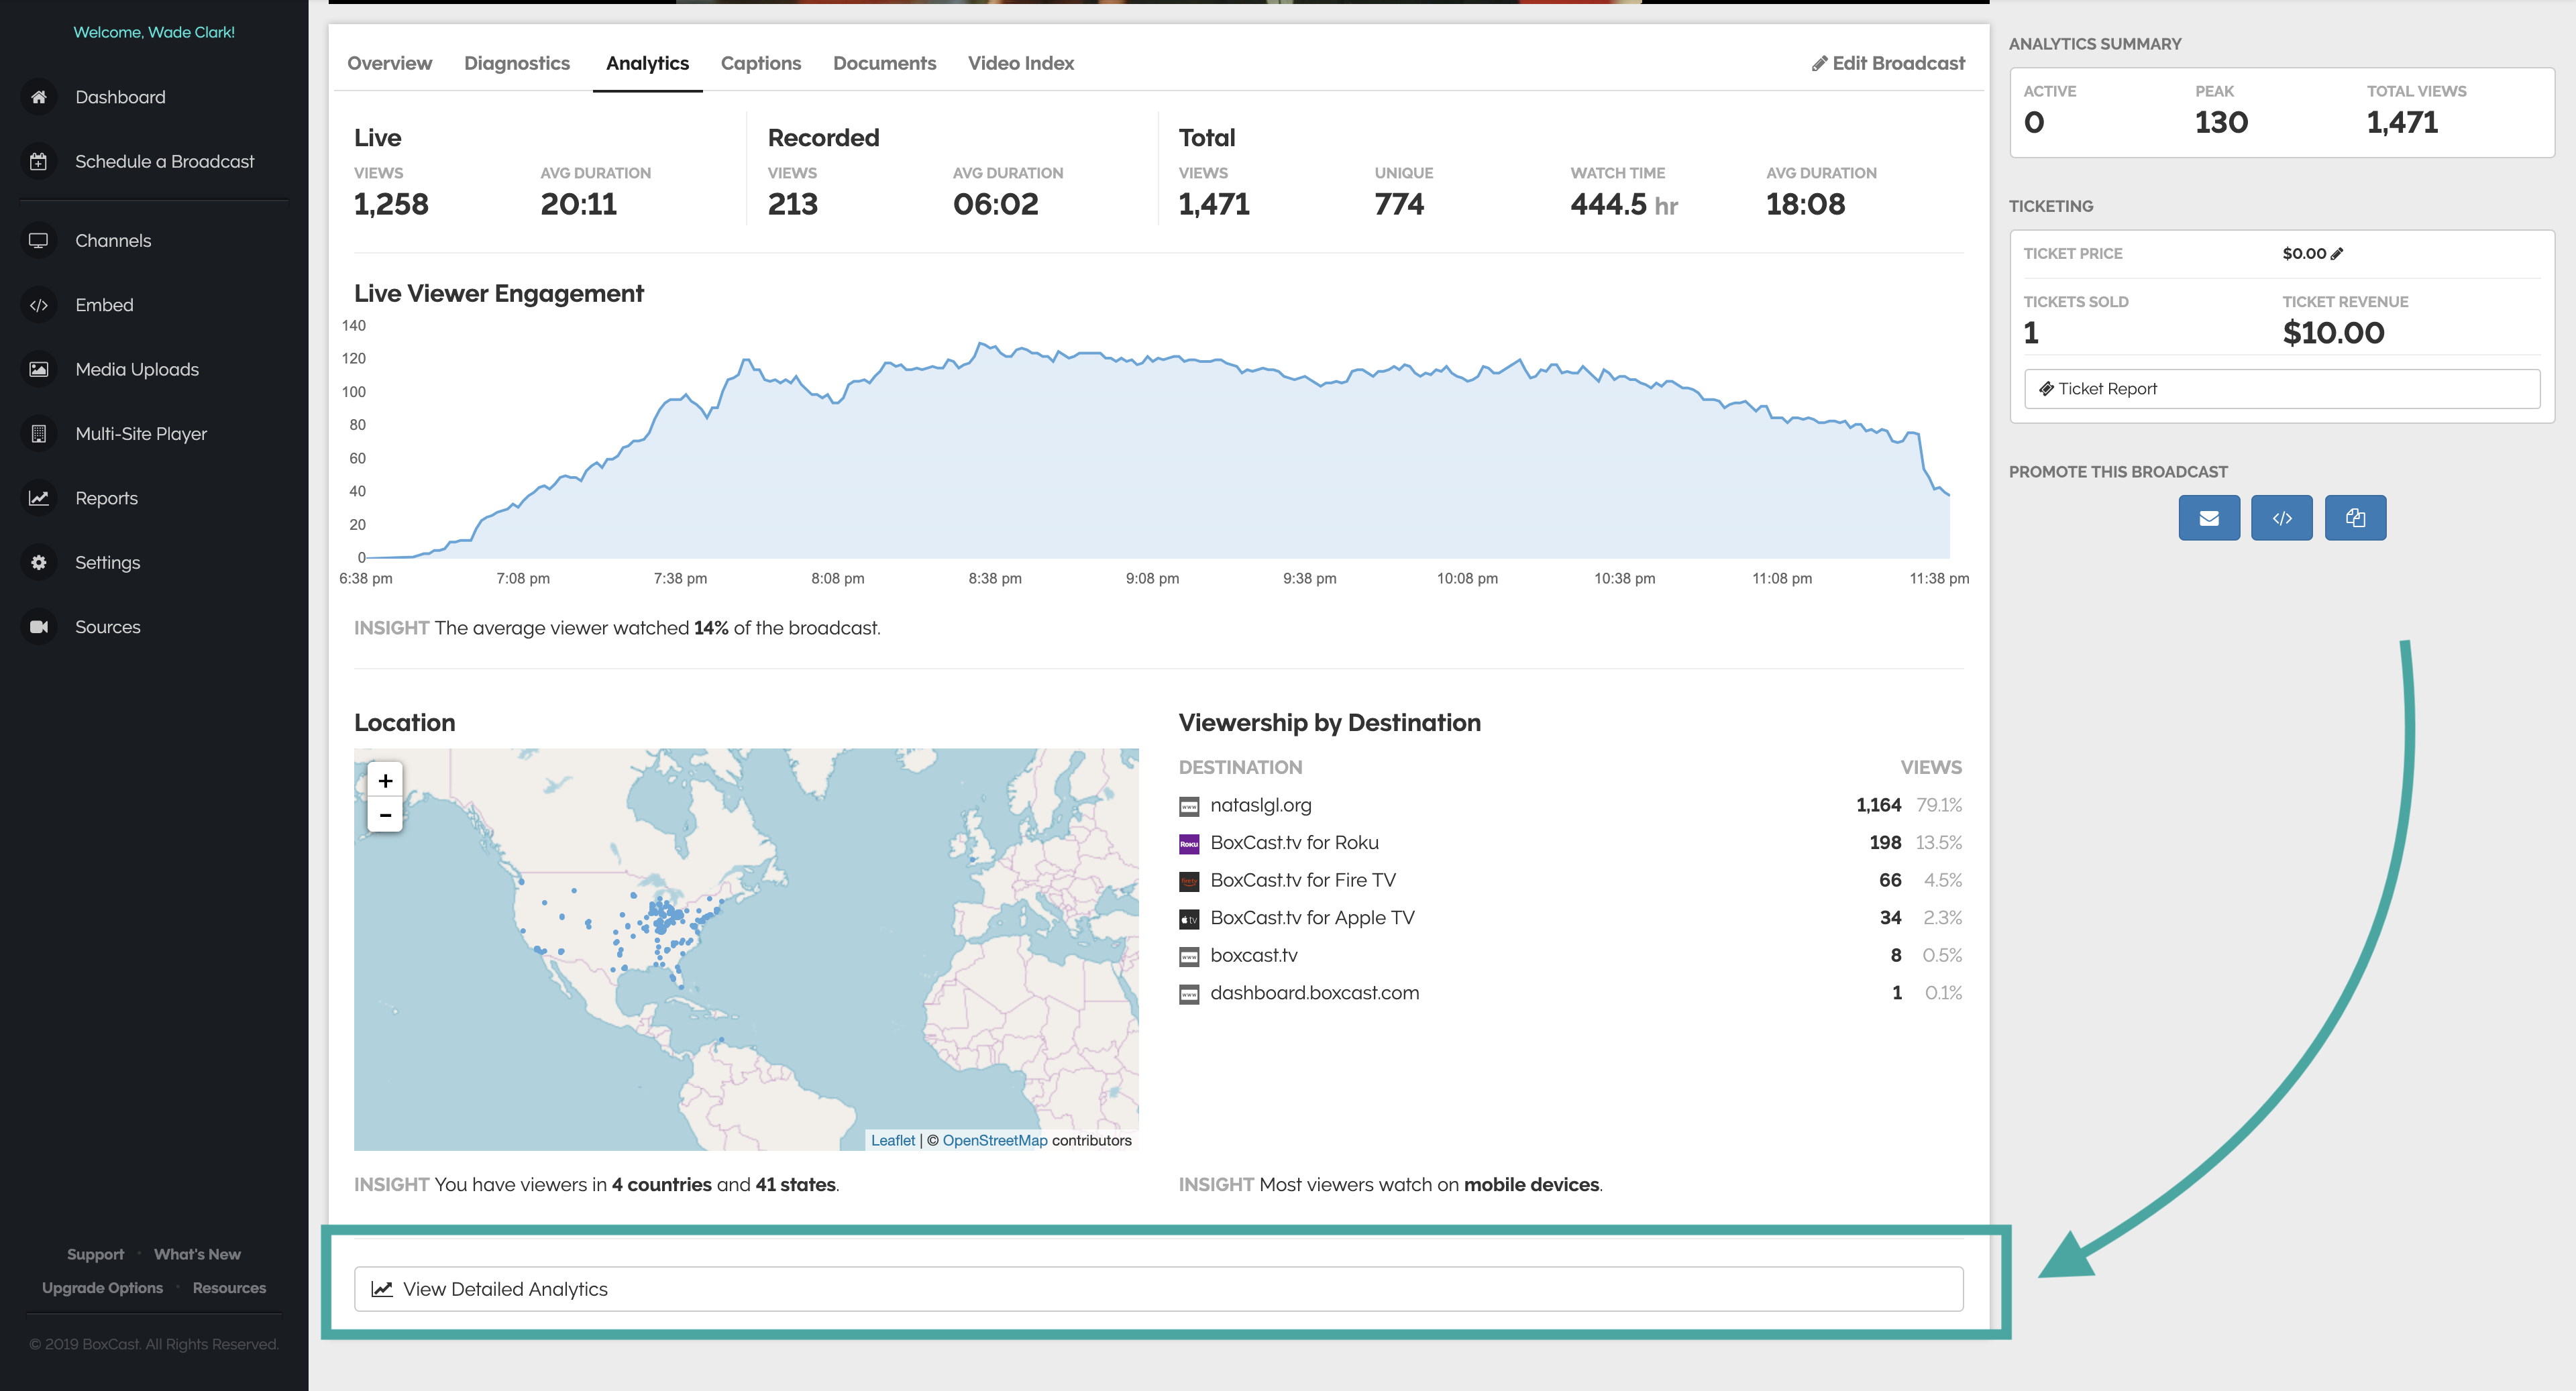
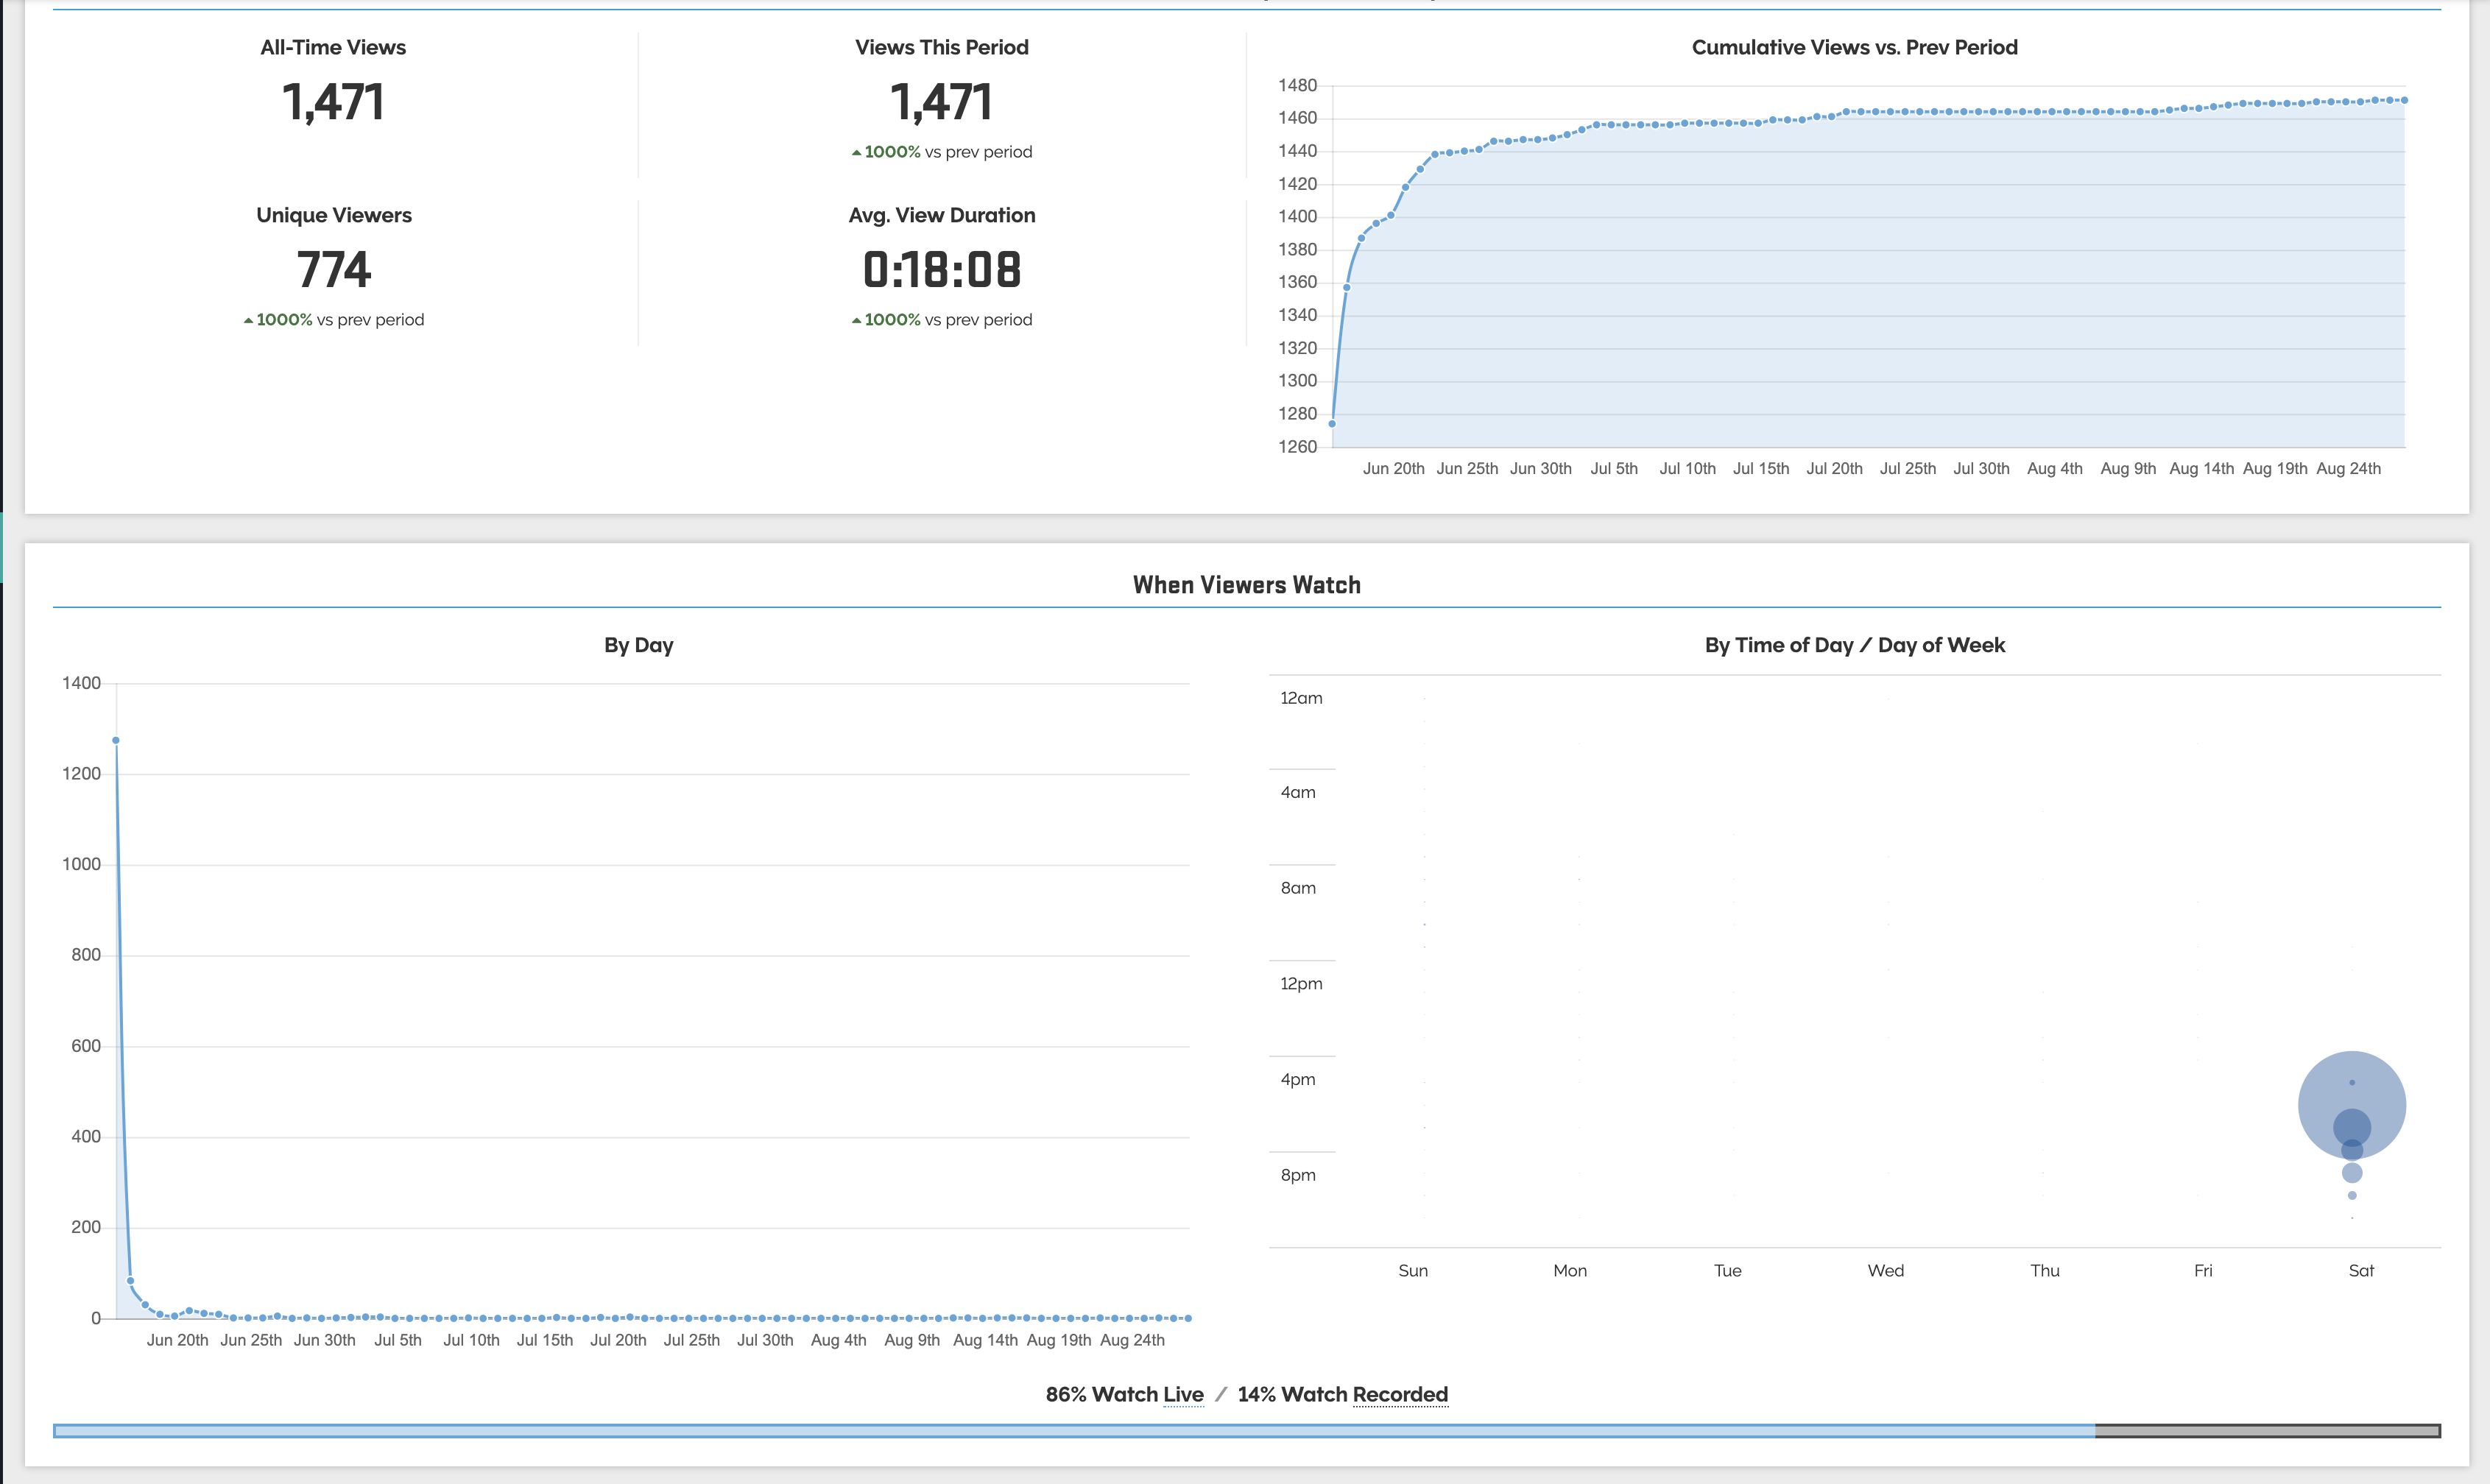
This will take you to a full reports page that will show you the following stats.

To find your analytics for your entire account, follow the steps below:
1. Go to the Reports tab on the BoxCast Dashboard.
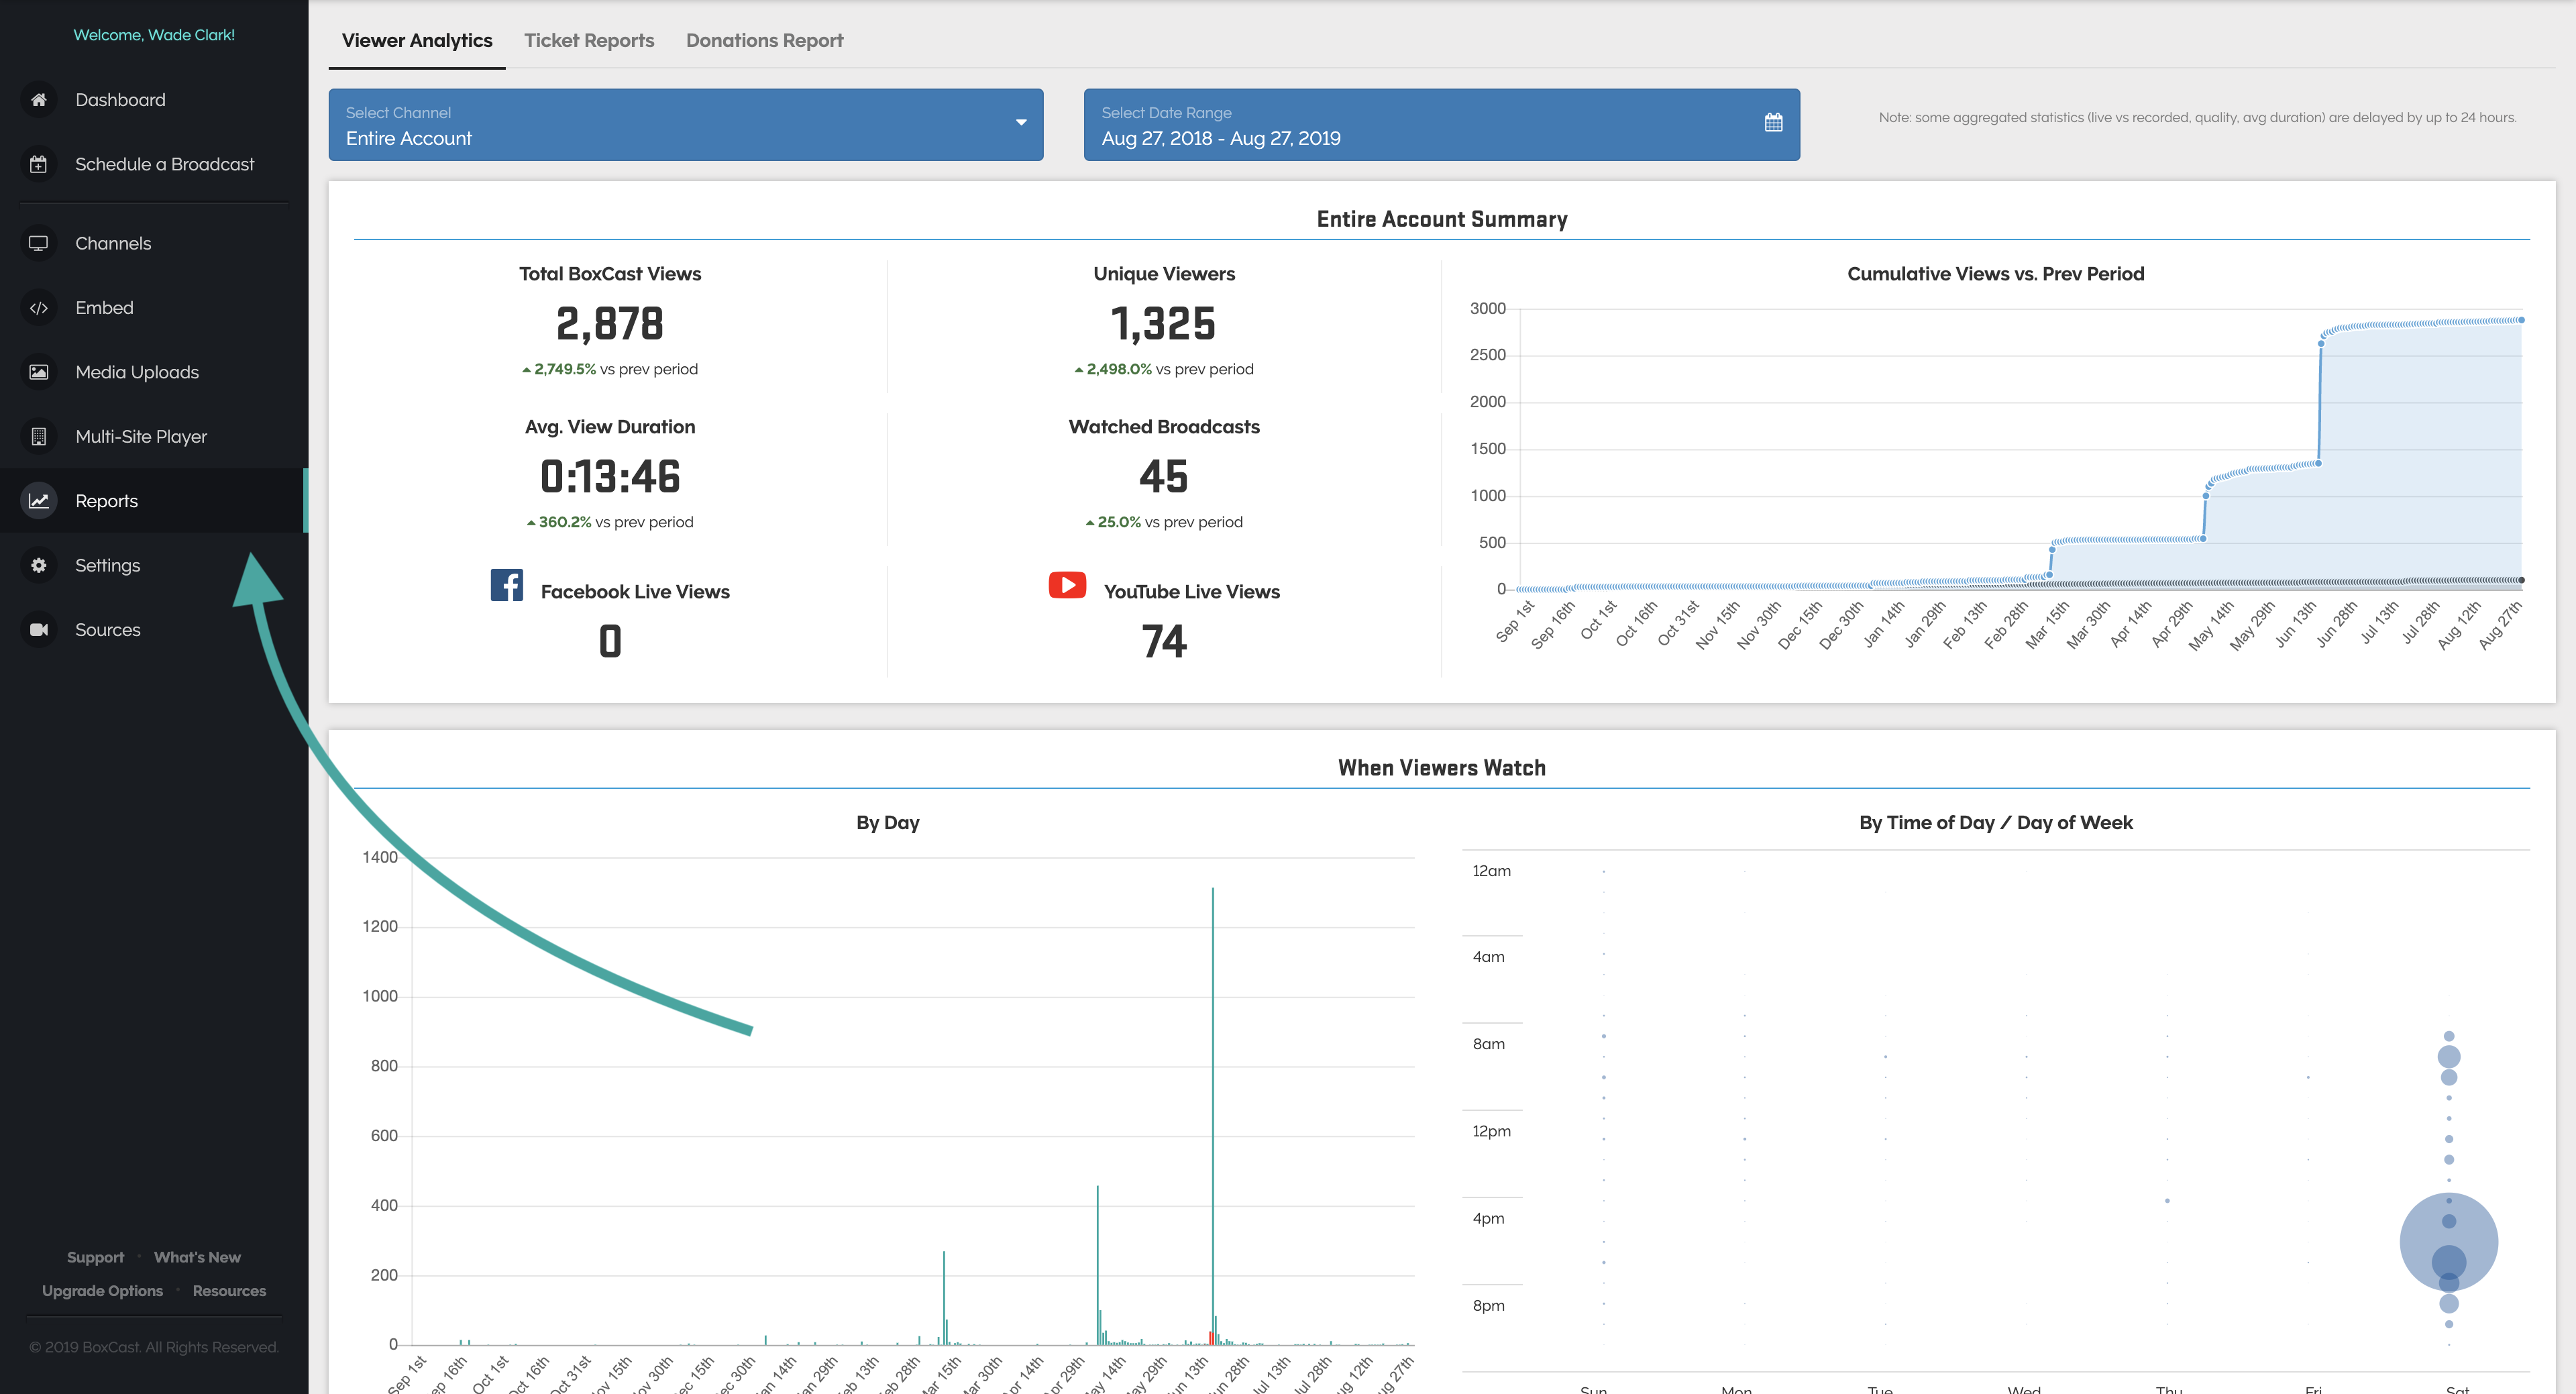
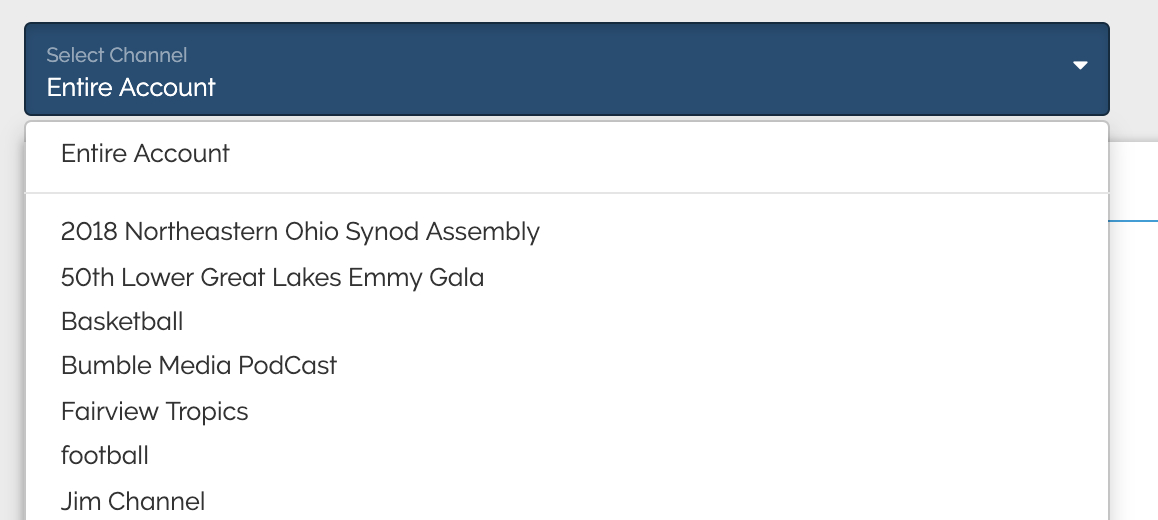
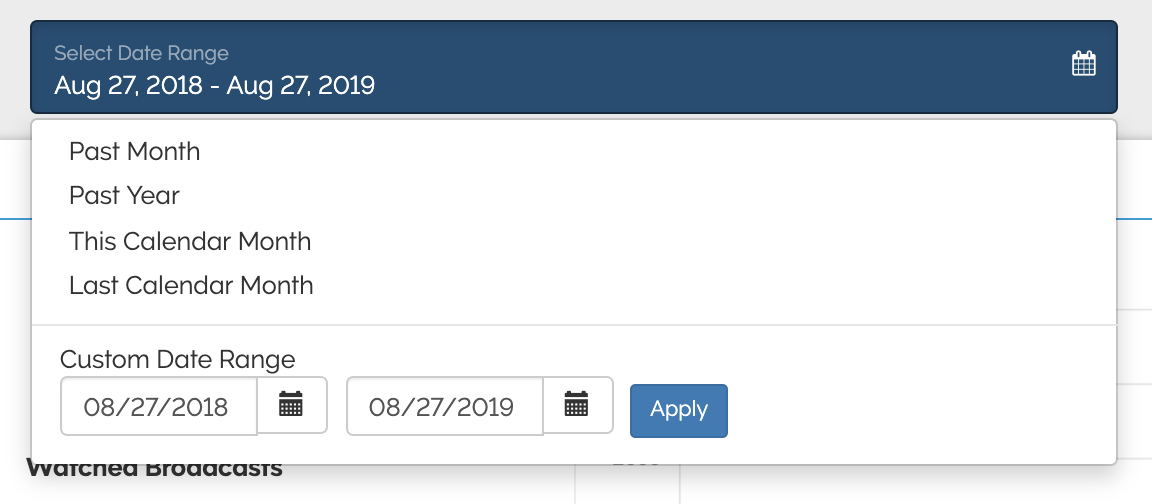
You can select the channel you want to see the stats for and select the date range.
With Viewer Analytics you will find the following stats about your account.
- Account or Channel Summary
- Total views
- Unique viewers
- Average view duration
- Count of watched broadcasts
- Comparison of each of those stats vs. the prior period
- Time series line graph of Cumulative views vs. Previous Period
- When Viewers Watch
- Views by day line graph
- By time of day bubble graph, which can be used to understand patterns on which days of week and times on those days that viewers are most engaged
- How Viewers Watch
- Live vs. recorded graph
- Playback quality graph (NOTE that a few video player clients report the computer's screen resolution rather than actual video quality level, so you might see a value higher than your actual broadcast resolution)
- Playback host graph
- Mobile vs. desktop graph
- Browsers graph
- Operating systems graph
- Where Viewers Watch
- Map of viewers globally, with the bubble overlay radius approximating how many views came from a certain geographic region
- Top 10 regions listing
- Hall of Fame
- Most Viewed Broadcasts
- Achievements
Common Questions
Q: What is the difference between Total Views and Unique Views?
A: Total views counts of ALL views of the video both live and archived. If someone refreshes the page, that would count as 2 views for the broadcast. If someone is watching the broadcast and leaves and comes back to the broadcast, that would count as 2 total views. A Unique Viewer comes from a specific device and that device can refresh the page as many times as it wants and that counts as 1 view. That device could also stop watching the stream and come back later on to watch the stream and that would also count as 1 view. We think Unique Views is a much more accurate number of viewers compared to Total Views.
Q: Can I see the name of the person watching the broadcast?
A: No, BoxCast does not track the name or email of individual viewers.
Q: Can I get a PDF of the Viewer Analytics?
A: No, If you think this would be a helpful feature, please email ideas@boxcast.com and hopefully we can add this in the future!
Check out our blog post to learn more - https://www.boxcast.com/blog/enhanced-analytics-for-your-live-broadcasts
If you are not seeing these reports in your dashboard, please contact our client managers at CM@boxcast.com to add this feature on to your plan.